Figure 16. Displaying Cartesian Axes
This windows illustrates GaussView's Cartesian Axes display option.
GaussView contains a variety of controls and features for customizing the displays in view windows. These may be accessed via the View menu, and also via toolbar icons in some cases. The View menu may also be accessed by clicking the right mouse button in an open area of any view window or other molecule display.
The Center button and the View=>Center menu item centers and resizes the image in the active view window to make the most efficient use of the workspace.
Several View menu options toggle the display of optional items within a view window
View=>Hydrogens: Display of hydrogen atoms in the view window (initially on).
View=>Dummies: Display of dummy atoms if present (initially on).
View=>Labels: Display numeric labels indicating atom sequence numbers (initially off).
View=>Symbols: Display the chemical symbol for each atom (initially off).
View=>Bonds: Display bonds between atoms (initially on).
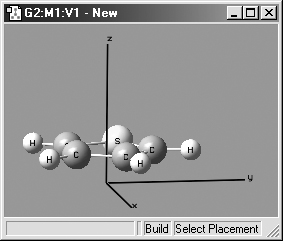
View=>Cartesian Axes: Display X,Y,Z axes (initally off). This feature is illustrated in Figure 16.
You can specify default values for these items via the General panel of the Display preferences. Note that the View=>Labels menu item is labeled Show Tags in the preferences pane. You can also exclude labels and symbols on hydrogen atoms or hydrogen and carbon atoms using the Exclude View Labels and Exclude View Symbols items in the Text panel of the Display preferences (both default to excluding no atom types).
Figure 16. Displaying Cartesian Axes
This windows illustrates GaussView's Cartesian Axes display option.
Figure 16a shows a molecule view which includes dummy atoms. They appear as small purple atoms within the display. You can disable their display using the View=>Dummies menu path.
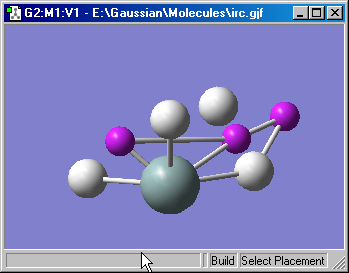
Figure 16a. Viewing Dummy Atoms
Dummy atoms with the Gaussian input for this molecule are displayed as
small purple atoms
The Display Format button and the View=>Display Format menu item both open the Display Format dialog. Each panel in this dialog also has a twin within the Display preferences feature. We will consider the General, Text and Molecule panels here and will consider the Surface panel later in this book.
The items in the General panel control molecule display quality, additional items displayed in addition to the atoms (as mentioned above) and the fog feature. It is illustrated in Figure 17.
The options in top part of this panel govern how the molecule appears both when it is being moved in the view window by mouse action and when it is not moving. On slower systems, it can be often useful to set the slider more toward the Realistic end of the scale for Stationary Object Display and more toward the Fast end of the scale for Moving Object Display.
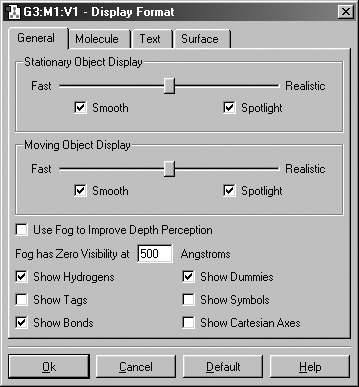
Figure 17. Display Format General Panel
The Smooth checkboxes enable/disable smoothing in the display, and the Spotlight checkboxes enable/disable simulated spotlighting on the window contents.
The Use Fog to Improve Depth Perception checkbox causes more distant atoms in the view window to recede to invisible, allowing nearer atoms to become more distinct. The Fog has Zero Visibility at field controls the depth at which atoms become completely invisible.
This feature is illustrated in Figure 18. In this example, the lefthand illustration shows the molecule with the fog feature disabled. In the righthand illustration, fog is turned on, and the frontmost atoms are much more distinct than more distant ones.
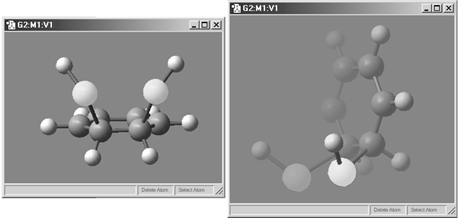
Figure 18. The Fog Feature
Compare the display types between the two windows to understand the effect
of fog.
The options in this panel control how atoms and bonds appear in the view window. The three popup menus specify how atoms in each of the three ONIOM layers will be displayed. If the ONIOM facility is not being used, then the setting for the High Layer is used. The Molecule panel is shown in Figure 19.
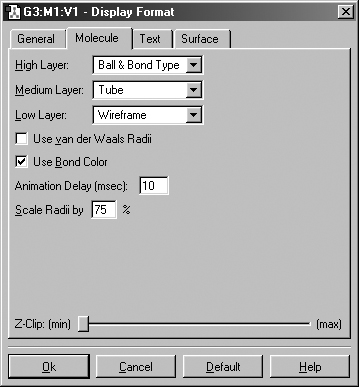
Figure 19. The Display Format Molecule Panel
The various items in this panel control various aspects of molecule displays.
The layer display settings are also used by some other GaussView features unrelated to ONIOM (e.g., displaying atoms at the boundaries of PBC unit cells).
The various supported display types are:
Ball & Stick: Molecule appears as a ball and stick model, with all types of bonds represented by single sticks. This is the default.
Ball & Bond Type: Molecule appears as a ball and stick model with single bonds represented by single sticks, and multiple bonds represented by multiple sticks, or in the case of aromatic systems, by dotted lines.
Tube: Molecule appears as a tube model with no indication as to bond type. Atom types are indicated by color bands on the tubes.
Wireframe: Molecule appears as a series of thin lines, colored by atom type and indicating bond type via the number of lines.
None: Atoms are invisible (useful only with multilayer models).
The Use Vanderwaals Radii checkbox and Scale Radii by field cause the atoms in the view window to be displayed at the indicated scaling of the van der Waals covalent radii. Using a scaling value of 150%-200% will produce a space filling-like molecular display.
The Z-Clip slider may be used to remove the frontmost portions of the image to allow views into the interior of the molecular display.
The Use Bond Color checkbox controls whether bonds are partially or entirely colored by atom type in the tube display format. The two options are illustrated in Figure 20.
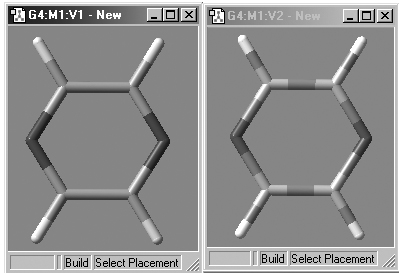
Figure 20. Tube Display Formats
These windows show pyrazine using the the tube display format without (left)
and with (right) the Use Bond Color item checked. The format on the left is
the default.
The Text panel of the Display Format dialog controls the font and color of atom labels and symbols as well as allowing you to exclude certain atoms from labeling as previously mentioned. It is illustrated in Figure 21.
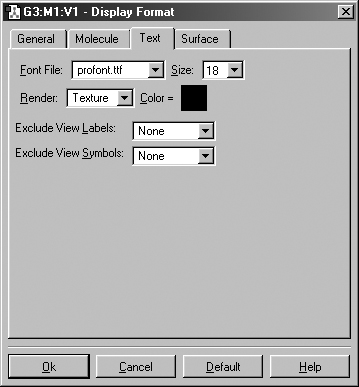
Figure 21. The Text Panel of the Display Format Dialog
This panel allows you to specify various aspects of text labeling of atoms.
The Font File menu allows you to select from several font files provided with GaussView. The Size field specifies the relative type size: type resizes with the molecule as you zoom in or out. The Render field specifies the type rendering method, and the Color field specifies the type color.
View=>Add View and the Add View button may be used to add a new view window for the current model. This view is independently adjustable, and begins with the default settings (rather than those of the current view window).
The View=>Synchronize menu item can be used to link distinct view of the same model with respect to mouse-based view operations: rotation, translation, zooming, etc. You must enable this item for each view window that you want to synchronize. Note that synchronization does not affect other display choices and that views are automatically synchronized with respect to structural changes.
The Windows menu contains items which control which view windows are open and/or visible.
All views and associated dialogs of a molecule group can be hidden or shown by checking or unchecking the corresponding item in the Windows=>Show Molecule Groups submenu. Individual view windows can be hidden or shown using the corresponding item at the bottom of the main Windows menu. Selecting a window here makes it the active view. Note that hiding is not the same as closing and is solely for the purpose of managing screen space. It is also different from minimizing a window as no icon is visible for a hidden window as there is for a minimized one.
The All and None items on the Windows=>Show Molecule Groups submenu display and hide windows for all model groups (respectively). The related Windows=>Restore All menu item opens all minimized view windows (but not hidden ones).
The Windows=>Close and Windows=>Close All items close the active window or all view windows (respectively).
The Windows=>Previous and Windows=>Next items (and the equivalent Previous and Next buttons) activate the previous or next window in sequence.
Finally, the Windows=>Cascade and Windows=>Tile menu items (and the equivalent Cascade and Tile buttons) arrange all windows in an overlapped pile or resize them and rearrange them on the screen so that the maximum number are simultaneously visible (all of them, if possible).
Previous Next