Viewing Optimization Results and Other Structure Sequences
When you open a results file containing such results from optimizations, potential
energy surface scans, IRC calculations or ADMP or BOMD trajectory calculations,
you will need to check the Read intermediate geometries (optimization only)
checkbox in the Open File dialog in order to retrieve all of the
geometries that are present (see Figure 69). When you do so, each geometry that
is present becomes a separate model within a new molecule group (by default).
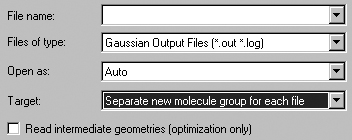
Figure 69. Retrieving Intermediate Results from Optimizations and Similar
Jobs
The setting in the Target field above is the recommended one for opening
files containing multiple structures. Don't forget to check the Read intermediate
geometries checkbox, or only the final structure will be retrieved.
You can animate the various structures using the buttons in the view window's
toolbar when the view window is set to single model mode. Animation begins by
pressing the green circle button in the toolbar. The animation can then be stopped
via the red X icon which replaces it. The animation speed is controlled by the
Animation Delay setting in the General panel of the Display
preferences.
The remaining items on the Results menu (Scan, IRC, Trajectory, Optimization)
all allow you to view plots of energy and other results from calculations that
produce multiple structures among their results. Figure 70 illustrates the displays
for a geometry optimization.
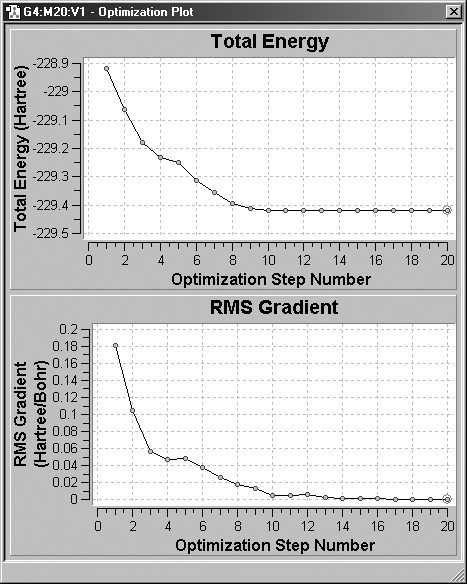
Figure 70. Plots from a Geometry Optimization
These plots display the total energy and root-mean-square gradient for each
optimization point.
The specific plots that appear vary by job type
-
Optimizations: Total Energy and RMS Gradient.
-
Potential Energy Surface Scans: Scan of Total Energy.
-
IRC Reaction Path: Total Energy Along IRC and RMS Gradient Along
IRC.
-
Trajectory (ADMP or BOMD): Nuclear Kinetic Energy, Electronic
Kinetic Energy, Potential Energy, Total Energy, Total
Angular Momentum, Conservation of Alpha Electrons, Average
Alpha Idempotency, RMS Alpha Idempotency, Conservation of
Beta Electrons, Average Beta Idempotency, and RMS Beta Idempotency
(the latter three apply to open shell calculations).
Zooming in on GaussView Plots
The zooming feature described in the previous section is available in all GaussView
plot displays. If you click a marquee and then drag the mouse in an NMR
display window, the display will zoom in on the selected region. This effect
is illustrated in Figure 70a.
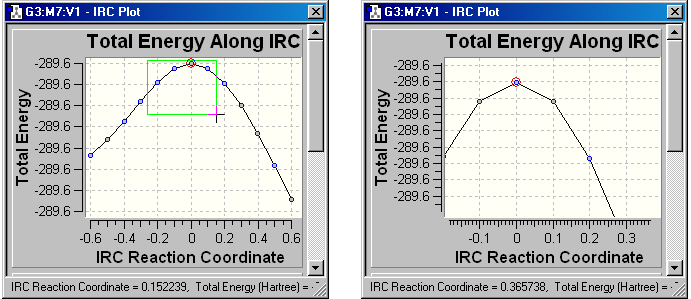
Figure 70a. Zooming in on a Region of a Plot
The right picture shows the effect of zooming in on the region highlighted
with the cross-shaped cursor in the left dialog, which shows an IRC energy plot.
You can restore the display to its original form by right clicking
in any part of the window and then selecting Zoom Out from the resulting
context menu.
Previous Next