Displaying Vibrational Modes and Spectra
The Results=>Vibrations menu item is used to access various spectra results
(except NMR). It allows calculated vibrational data to be displayed as dynamic
screen motions, based on information from a frequency calculation. This menu
item displays the Display Vibrations window, as illustrated in Figure
64.
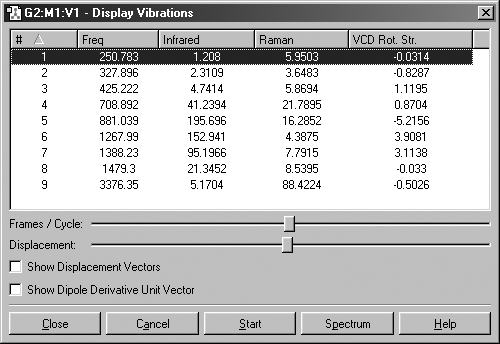
Figure 64. The Display Vibrations Window
This dialog displays a table of all computed spectra (excluding NMR). In
this case, we see the vibrational frequencies, infrared intensities, Raman intensities
and VCD rotational strengths. The window's Spectrum button is used to access
graphical representations of the predicted spectra.
The Display Vibration dialog box shows which vibration is currently
selected for dynamic display. You can start this display by selecting the Start
button, and halt it by clicking on the Stop button. The molecule will
begin a cyclical displacement showing the motions corresponding to the vibration
selected. You can select other modes by selecting the desired mode on the scrolling
list in the Display Vibrations dialog. You can select a new mode
without halting the previous one. You can also rotate and move the vibrating
molecule, using the normal mouse buttons.
The two slide bars in the middle of the Display Vibrations dialog adjust
the speed and magnitude of the motion. The remaining checkboxes have the following
meanings (see Figure 65 for examples):
-
Show Displacement Vectors: Display the motion associated with the
vibration as a displacement vector in the view window.
-
Show Dipole Derivative Unit Vector: Display the dipole derivative
unit vector as a vector in the view window.
Default values for the settings in the Display Vibrations
dialog may be specified with the Vibrations preferences panel.
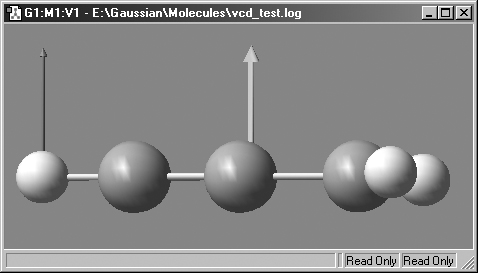
Figure 65. Displaying the Displacement Vector and Dipole Derivative Unit
Vector.
The displacement vector is on the right, and the dipole derivative unit vector
is on the left.
The Spectrum button presents Gaussian's estimate of the spectrum
in line format. Note that the intensity values are relative to the highest value
in the present set, and bear no precise relationship to experimental band intensities.
Example spectra are illustrated in Figure 66.
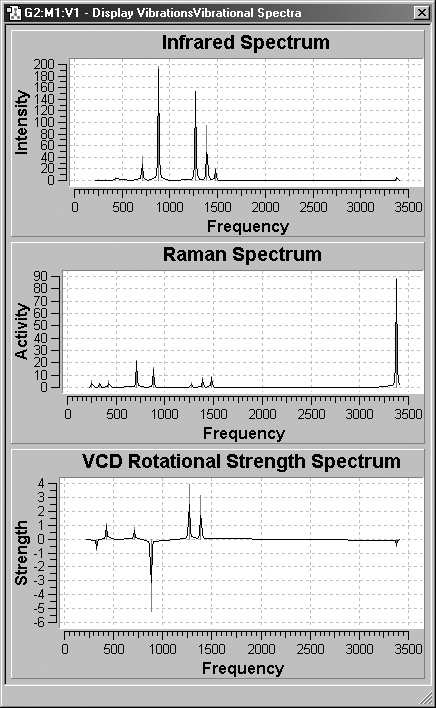
Figure 66. GaussView Spectra Displays
These windows display the IR, Raman and VCD spectra graphically, using the
same results as in Figure 64.
Zooming In
If you click a marquee and then drag the mouse in an NMR display window, the
display will zoom in on the selected region. This effect is illustrated in Figure
68a.
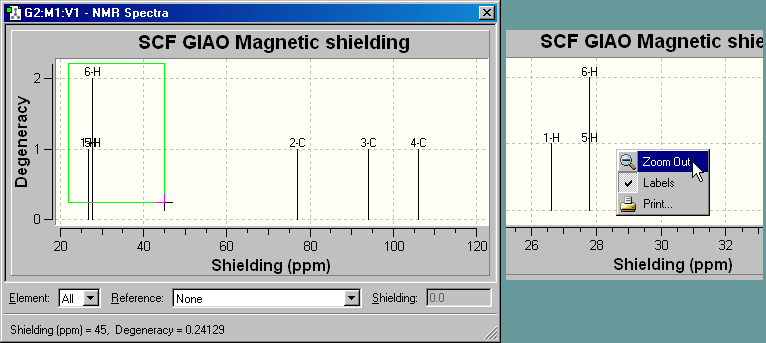
Figure 68a. Zooming in on a Region of the Spectrum
The right picture shows the effect of zooming in on the region highlighted
with the cross-shaped cursor in the left dialog (in this case, it is an NMR
spectrum, discussed below). The right picture also displays the context menu
which can be reached at any time by right clicking the mouse.
Use the Zoom Out item from the context menu to restore
the original display.
Displaying NMR Spectra
The Results=>NMR menu item displays the spectrum from an NMR calculation.
An example spectrum is shown in Figure 67.
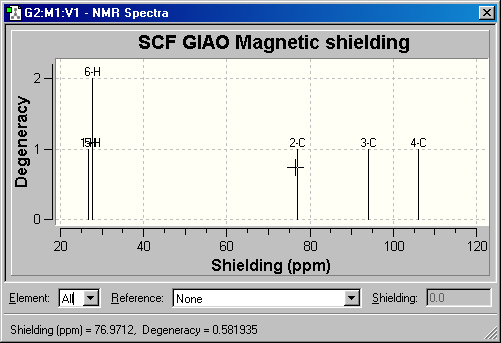
Figure 67. NMR Spectrum Display
This is the default NMR display format. It displays all computed peaks. Clicking
on a peak with the cursor displays the shielding value and degeneracy in the
lower left corner of the window (e.g., peak 2C above)
The fields at the bottom of the NMR Spectra window allow you to view
the same data as relative values with respect to TMS or other standards (see
Figure 68). To use this feature, first select the desired element in the leftmost
popup menu, and then select one of the available standard calculation results
from the Reference field. The peaks will then reflect relative values
with respect to the selected reference.
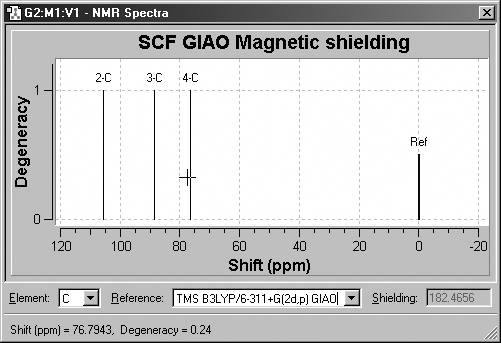
Figure 68. Displaying NMR Chemical Shifts
Clicking on a peak in this display mode shows the numeric chemical shift
with respect to the specified standard in the lower left corner of the window.
The corresponding shielding value is displayed in the Shielding field.
Adding Additional NMR Reference Data
You can add additional reference data to GaussView by running
the appropriate calculations and then entering the sheilding results into the
file data/nmr.data in the GaussView distribution location. The
delivered version of the file looks like this:
# Sym Shielding Description
  C   199.9853  "TMS HF/6-31G(d) GIAO"
  C   182.4656  "TMS B3LYP/6-311+G(2d,p) GIAO"
  C   199.1     "CH4 HF/6-31G(d) GIAO"
  H    32.5976  "TMS HF/6-31G(d)  GIAO"
  H    31.8821  "TMS B3LYP/6-311+G(2d,p) GIAO"
  Si  449.7802  "TMS HF/6-31G(d)  GIAO"
  Si  327.3890  "TMS B3LYP/6-311+G(2d,p) GIAO"
  N   260.8     "NH3 HF/6-31G(d) GIAO"
  N   258.4     "NH3 B3LYP/6-311+G(2d,p) GIAO"
  O   323.1     "H2O HF/6-31G(d) GIAO"
  O   320.0     "H2O B3LYP/6-311+G(2d,p) GIAO"
  B   106.7     "B2H6 HF/6-31G(d) GIAO"
  B    83.6     "B2H6 B3LYP/6-311+G(2d,p) GIAO"
The fields in the file hold the atom type, shielding value and
a descriptive string which appears in the Reference menu in the NMR
Spectra dialog.
Previous Next