Figure 59. The Surfaces Dialog
This dialog allows you to select cubes for display as surfaces and also to manipulate currently displayed surfaces.
The Results=>Surfaces menu item opens the GaussView Cubes and Surfaces facility (see Figure 59). It allows you to display various chemical data in three dimensions. The surface data may be generated from a Gaussian checkpoint file or be read in from a cube file. Note that there are two steps involved in actually displaying a surface:
Obtaining a cube by generating it or reading it in.
Generating the actual surface for display.
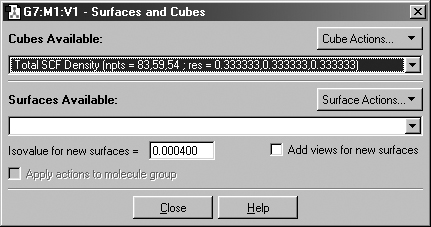
Figure 59. The Surfaces Dialog
This dialog allows you to select cubes for display as surfaces and also to
manipulate currently displayed surfaces.
The following items in the Cubes and Surfaces dialog box relate to cubes
Cubes Available: Shows data that is currently available for display by GaussView. These items appear after cubes are produced using the New Cube option and after a cube file is opened.
Cube Actions: Allows you to generate a new cube (New Cube), load a cube from an external file (Load Cube), save the current cube to an external file (Save Cube), and remove the current item from the Cubes Available list (Remove Cube).
The New Cube selection on the Cube Action button's menu brings up the dialog in Figure 60. It is used to generate new cubes from the electron density and other data in the checkpoint file. GaussView automatically invokes the cubegen utility.
The Kind popup selects the molecular property for which to generate a cube. For most selections, additional fields will appear to further specify the desired data. For example, in Figure 60, the density matrix to use when generating the electrostatic potential cube can be selected. Similarly, for molecular orbitals, the specific orbital(s) to generate are indicated via additional fields.
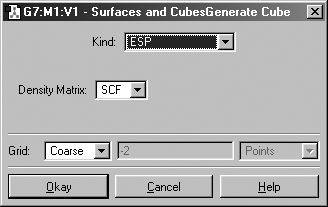
Figure 60. The Generate Cube Dialog
This dialog will generate the type of cube specified in the Kind field. Here,
we are generating a cube of the electrostatic potential computed from the SCF
electron density.
The Grid field is used to specify the denseness of the cube. Increased denseness brings increased computational requirements. Generally, the default setting of Coarse is adequate for most visualization purposes, Medium is adequate for most printing and presentation purposes. The equivalent number of points per "side" is indicated in the second field in this line for each of the Coarse, Medium and Fine selections. Use the Custom item to specify a different value.
Clicking the Okay button will generate the cube (as a background calculation) and exit the dialog. The new cube will appear in the Cubes Available list when the calculation finishes. You can view the job via the Calculation=>Current Jobs menu item or the equivalent Current Jobs button.
Note: Cubes generated on the fly in this manner are not saved to disk unless you do so explicitly; otherwise, they will be lost when GaussView terminates.
The following items in the Cubes and Surfaces dialog box relate to surfaces:
Surfaces Available: Displays a list of generated surfaces.
Isodensity for new surfaces: Specifies the iosdensity value used for generating new surfaces.
Add views for new surfaces: If checked, a new view window is opened to display the new surface. Otherwise, the surface is displayed in the current view window.
Surface Actions: This button brings up a menu of surface-related actions. Use items here to actually generate the surface in a view window. Note that, once generated, surfaces are tied to their original view window.
The Surface Actions menu includes these items
New Surface: Create a new surface for the selected cube, using the current settings of the related fields in the dialog (i.e., isodensity value and add new view).
New Mapped Surface: Create a new property-mapped surface (see below).
Show Surface: Make this surface visible in its view window.
Hide Surface: Hide this surface in its view window.
Remove Surface: Discard this surface, removing it from its view window and from the Surfaces Available list.
Figure 61 shows some example surfaces.
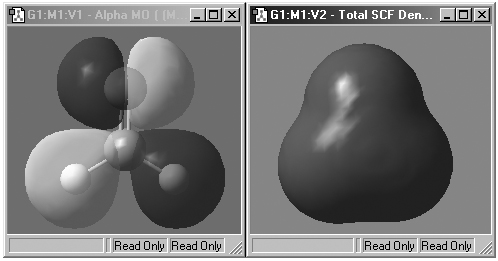
Figure 61. Example GaussView Surfaces
These windows display the HOMO molecular orbital surface (left, displayed
in transparent mode) and an electron density surface (right, displayed in solid
mode). Both are for formaldehyde.
Note that surfaces cannot be saved (only cubes can). Rather, they must be recomputed when they are desired.
GaussView also allows you to map the values of one property on an isosurface of a different property. This is accomplished by selecting the New Mapped Surface item from the Surface Actions button's menu. This will bring up the dialog illustrated in Figure 62.
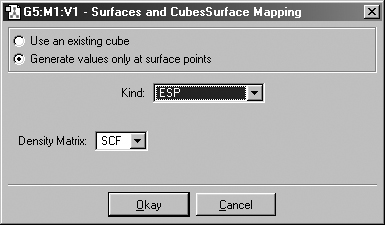
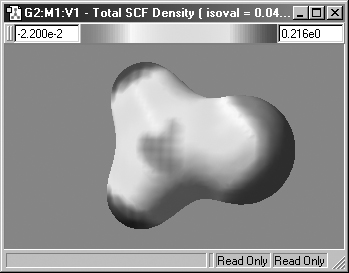
Figure 62. Creating a Mapped Surface
This dialog allows you to create a surface in which the coloring is determined
by the values of a second property. The window on the right shows an electron
density surface painted according to the value of the electrostatic potential
for formaldehyde.
The fields in this dialog have the following purposes
Use an existing cube: Use one of the current cubes as the colorization data. Select the desired surface from the list.
Generate values only at surface points: Generate the colorization data on the fly at each surface point. This is generally a faster choice, but it requires the Gaussian 03 version of the cubegen utility. Specify the desired surface for colorization data in the popup menu and other fields.
Surfaces may be displayed in solid, transparent and wire mesh forms. The surface display may be modified using the Display Format dialog's Surface panel (accessed via the View=>Display Format menu item and the equivalent Display Format button on the toolbar). The dialog format for a transparent surface is displayed in Figure 63.
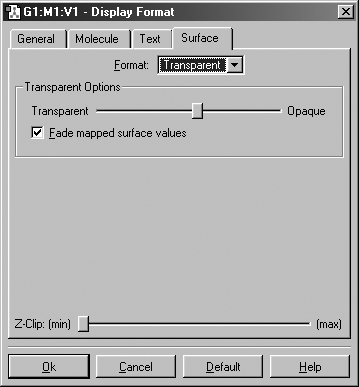
Figure 63. Customizing a Surface Display
This dialog allows you to modify the display of surfaces. Here, we are setting
the properties of a transparent surface. The Transparent Options slider varies
the opacity of the transparent surface. The Fade mapped surface value checkbox
causes the values in the midrange of the spectrum to become transparent (i.e.,
those close to zero).
The Z-Clip slider is present in the dialog for all three surface types. It may be used to remove the frontmost portions of the image to allow views into the interior of the molecular display.
Defaults for surface properties can also be set via the Display Format preference's Surface panel.
Previous Next